
✅ Expert-Approved Content
We definitely see many charts almost every day. Alas! Modt of us don’t know the names of them. It will surely make you confident , if you know the names of
● Bar Graph.
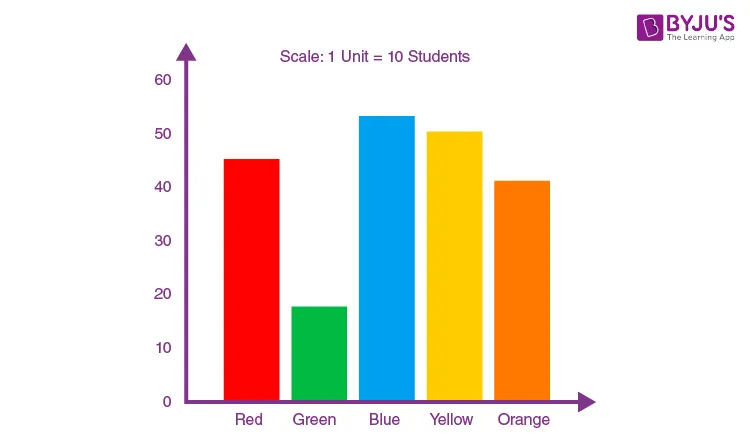
This is a bar graph. It is used for categorized data.
● Spider Diagram.
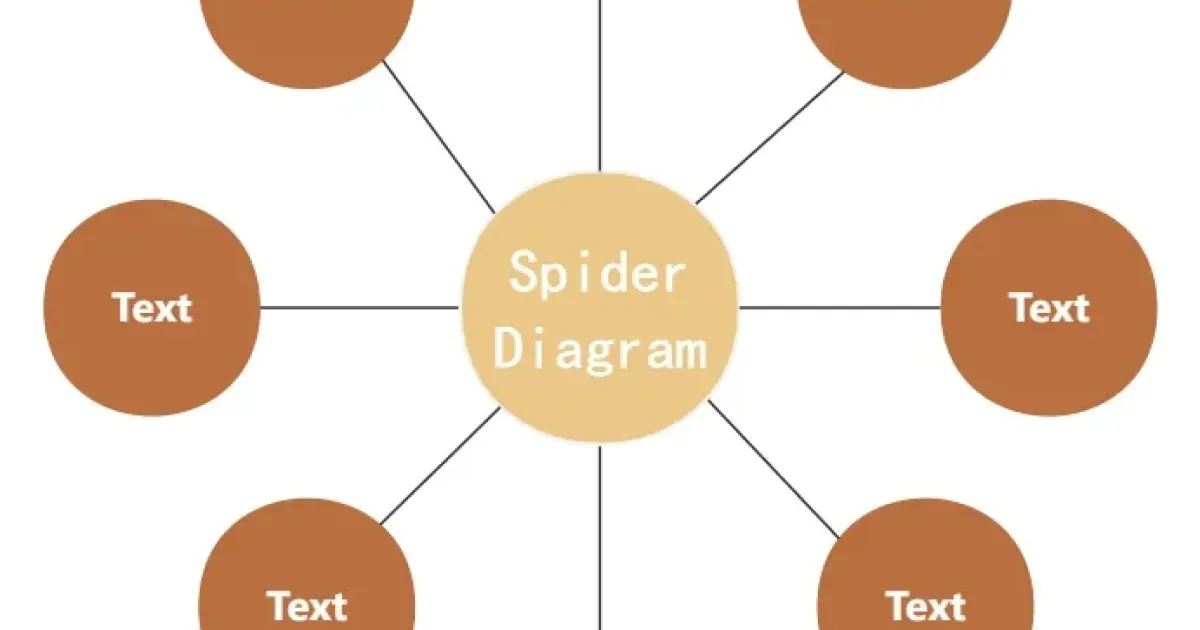
This is a spider diagram used to indicate multipale data from one factor.
● Gauge Chart.
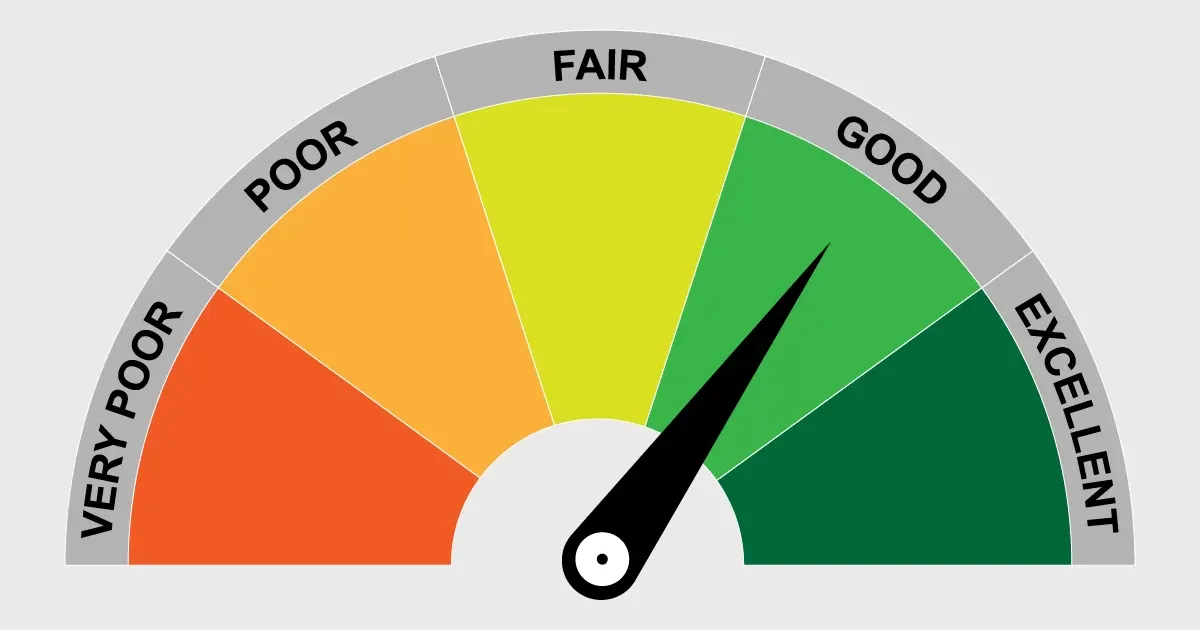
It’s used in vehicles mostly to indicate minimum and maximum.
● Radar chart.
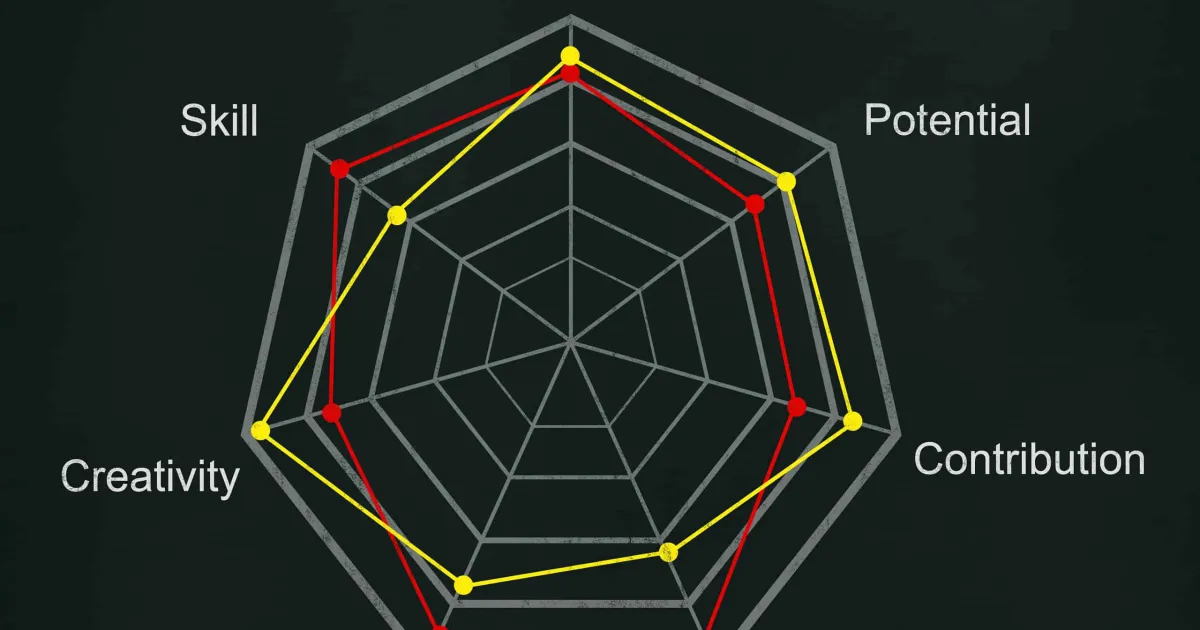
This is a radar chart and mostly used in ships.
● Venn Diagram.
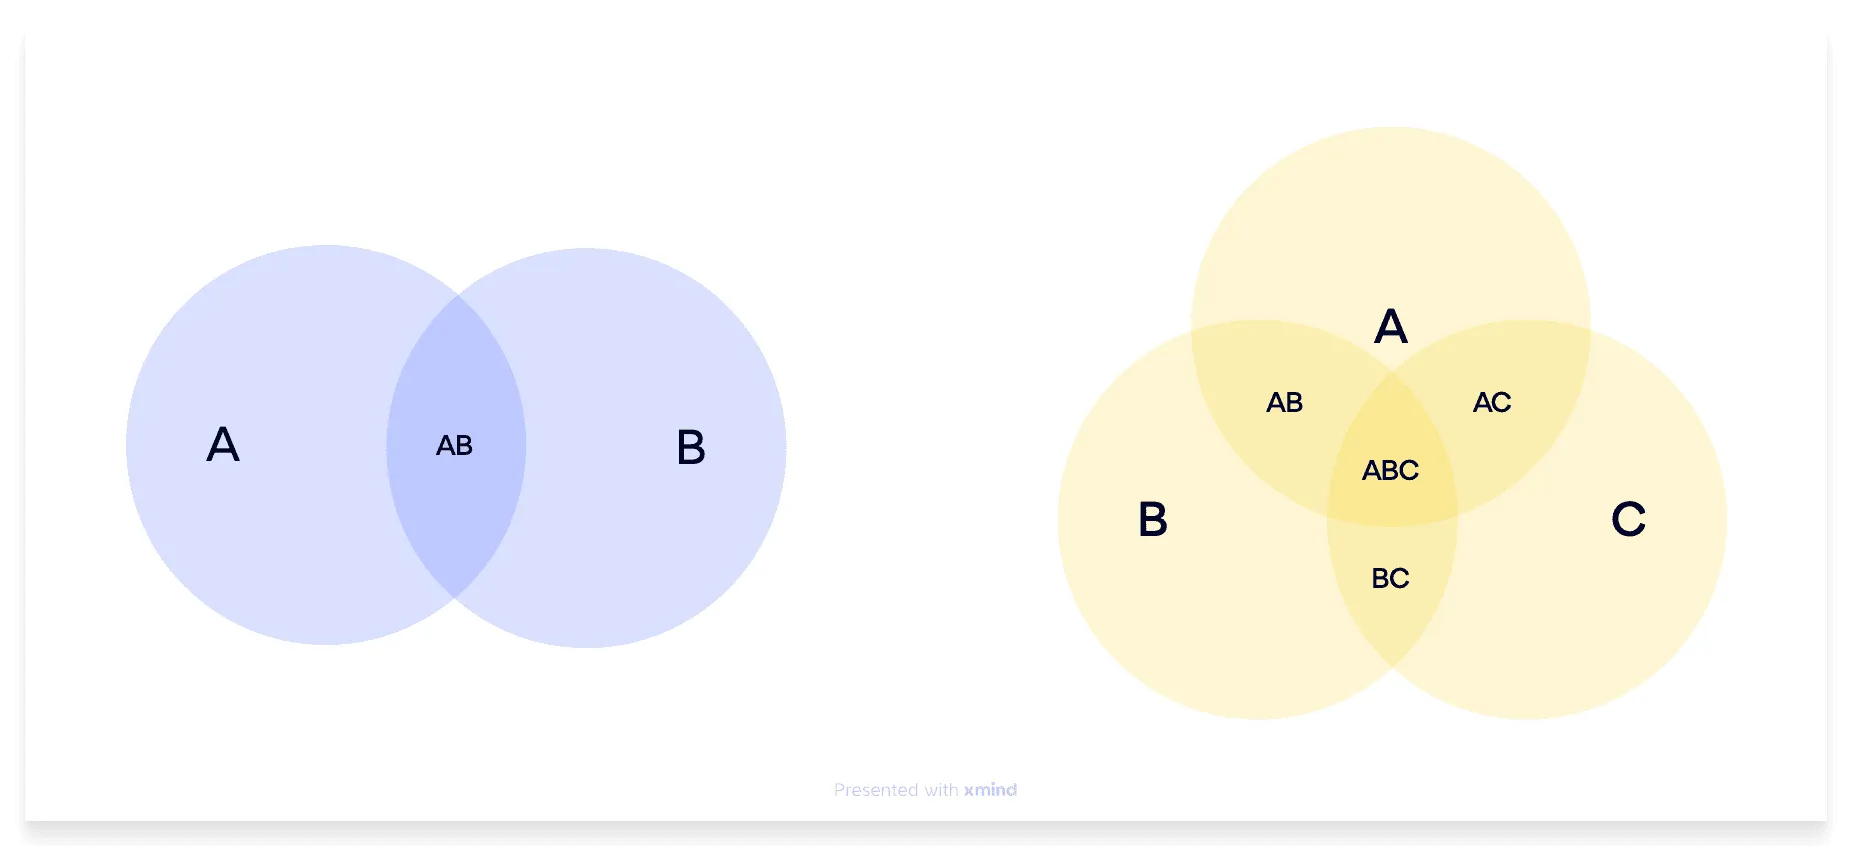
This is called a venn diagram. It’s used to show a mixture of information.
Your comment will appear immediately after submission.